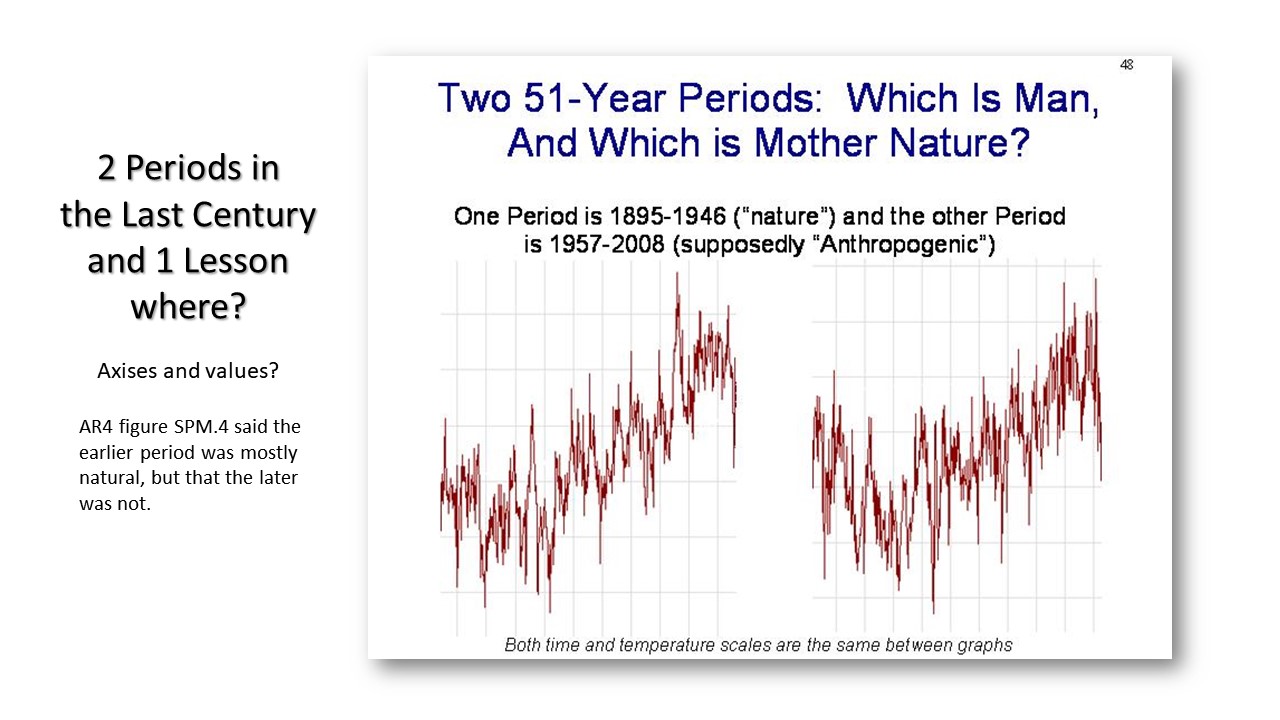
Two Temperature Curves
Slide 30 in this series.
These two time periods point to both a simularity in temperature curves, each over 50 years of records, with one out of the industrial zone and the other in the period of time assumed to be affected by human emissions.
Note that the appearance is to almost an overlay.
This indeed begs the question, as voiced by Prof Linzen, that the latter curve is not necessarily caused by human CO2 emisisons. Circumstantial question at least.
NEXT: Turning to ACO2, how does this compare with the observed CO2?
The links below are to the pages or slides in this section, which covers the science of CO2.