CO2 Increase & Absorption
Slide 13 in this series.
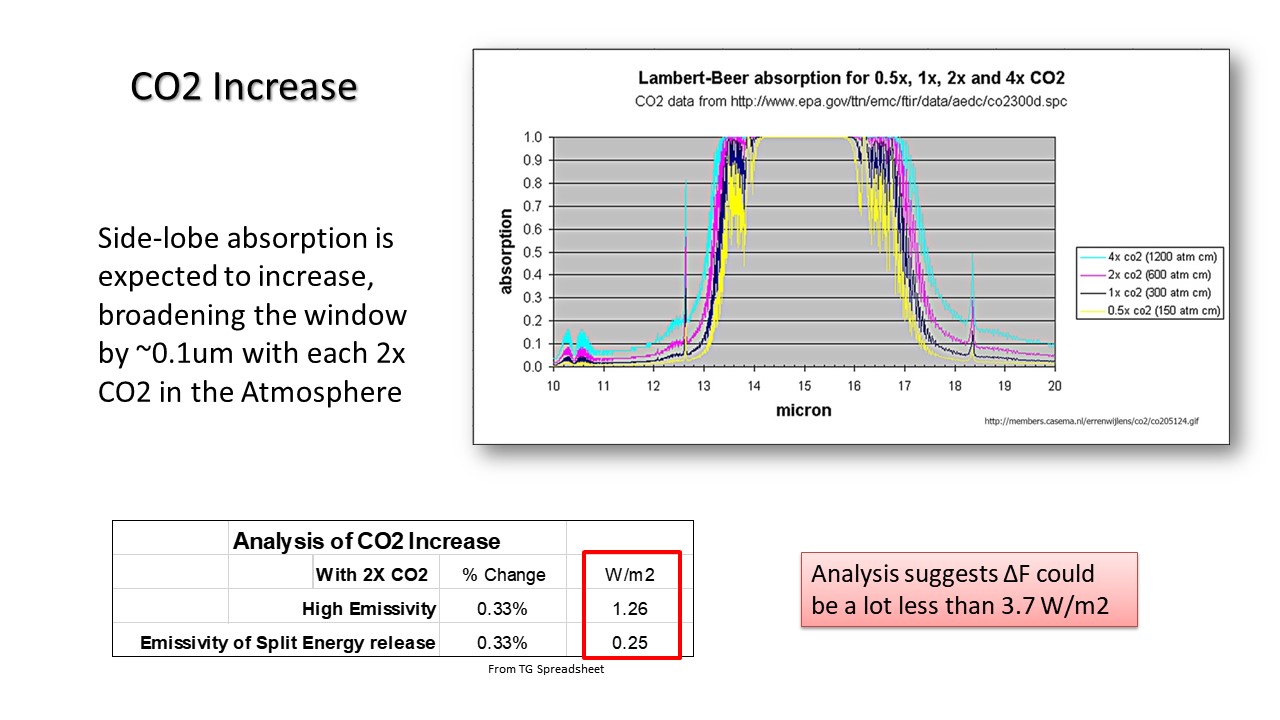
The absorption curve below from the EPA shows the absorption for various CO2 increase values. The increase is not in the upper level in the center or the so-called notch but rather the side lobes. It is estimated that the width of this absorption window increases by 0.1um in width with an increase of 2x.
Using the 0.1um width increase i have calculated the increase in delta RF. The values are shown in the table below.
In both cases the increase in CO2 is assumed to be 2x. High emissivity is the case where the earth follows a Black Body emission with emissivity of 1. Low emissivity is where the emissivity is reduced to acknowledge that there are other energy release mechanisms. This emissivity is calculated to be fraction of what shows up in the AGW literature.
The results indicate that the delta RF or Delta F is a good deal lower than the 3.7W/m2 used by AGW. In fact in the low emissivity case it is only 7% of what AGW uses.
NEXT: Leaving the RF question for a moment let us turn to the IR absorption simulators to see what can be learned.
The links below are to the pages or slides in this section, which covers the science of CO2.