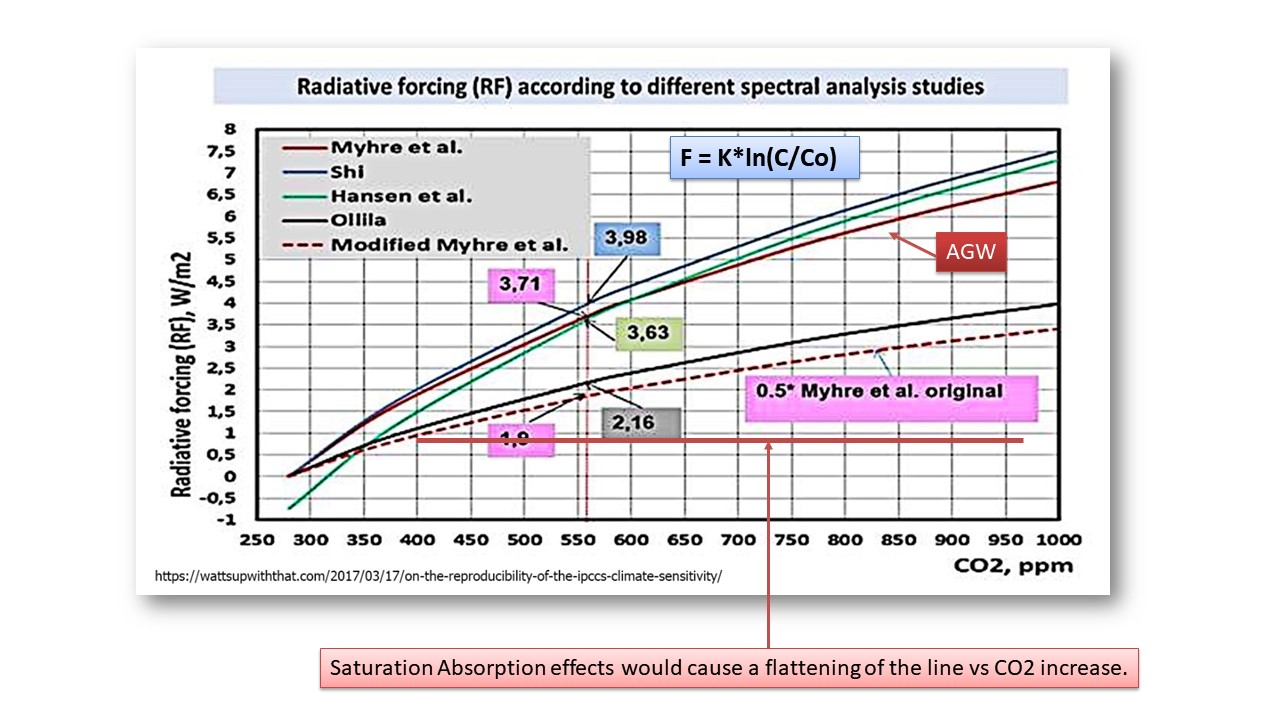
Radiative Forcing vs CO2
Slide 12 in this series.
These curves show the different radiative forcing for changes in CO2. The formula is logarithmic in nature, so an increase of 100ppm does not have a linear increase in temp. AGW curves are shown. Saturation effects can greatly alter that.
These curves also show a wide variety of radiative forcing versus CO2 levels.
The curve on saturation is worth noting, as that is a distinct probability for CO2.
NEXT: Increasing CO2 increases absorption but what does the absorption curves look like?
The links below are to the pages or slides in this section, which covers the science of CO2.