Temperature at Several Altitudes
Slide 17 in this series.
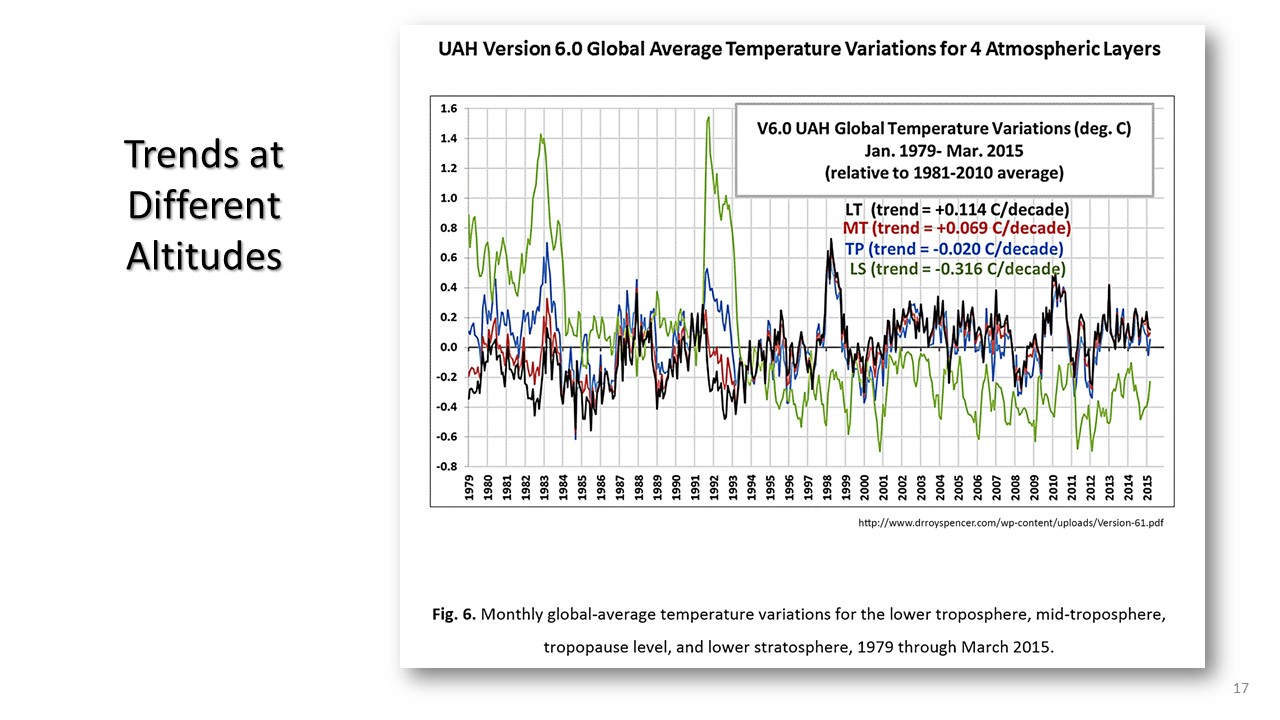
The graph below shows the variation in temperature in this dataset with altitude variation. Since this dataset is not measuring temperature directly, but from radiation, there is some concern for the accuracy of this data.
UAH 6.0 as was shown is likely to be more accurate than UAH 5 series data.
The best conclusion from this data is the trend line difference betweeen the lower troposphere (LT), the mid (MT), and the upper troposphere or tropopause and the even higher lower stratosphere.
Tropopause is the altitude where the temperature is close to a constant. The interesting aspect of this data is the downward trend in the lower stratosphere, something that AGW predicted just the opposite.
NEXT: Comparison of different data predictions and even measurements.
A full range of topics on how global temperature works, is reported, adjusted, and some insignts into its accuracy.