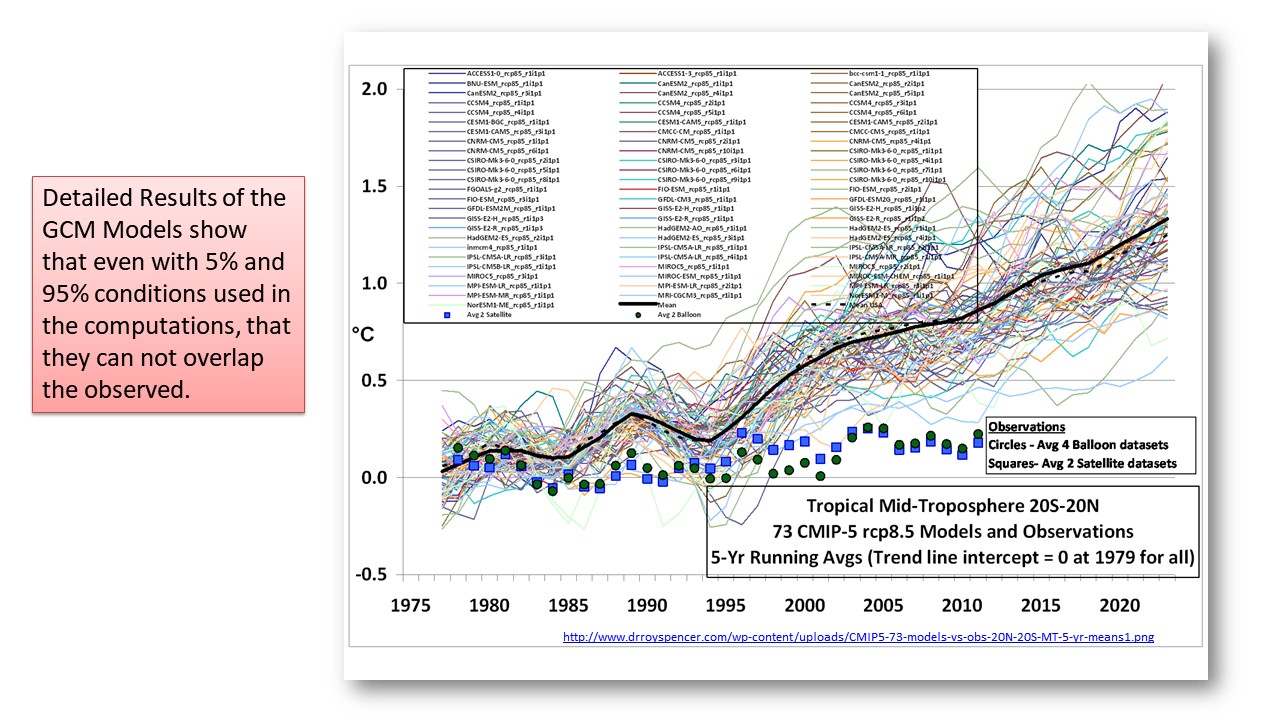
GCM Model Output Detailed
Slide 8 in this series.
The more detailed array of models shows the same dilemma as the average did in the last slide or page.
The closest curve is one that assumes less of a role for CO2 and bends the 2.5% precentile downward, coming close to the actual. There is no way to bend the conclusions here to make the GCM models look good.
One can also wonder why so many full models are needed. Given the holes in other theories especially on CO2 and its impact on outgoing IR and the atmosphere, modelling just appears to be a lucrative business opportunity.
NEXT: What is the GCM hotspot issue?
The topics cover a wide range of material on the GCM climate models.
Alternative Models Last Century