Solar Activity Key Driver
Slide 14 in this series.
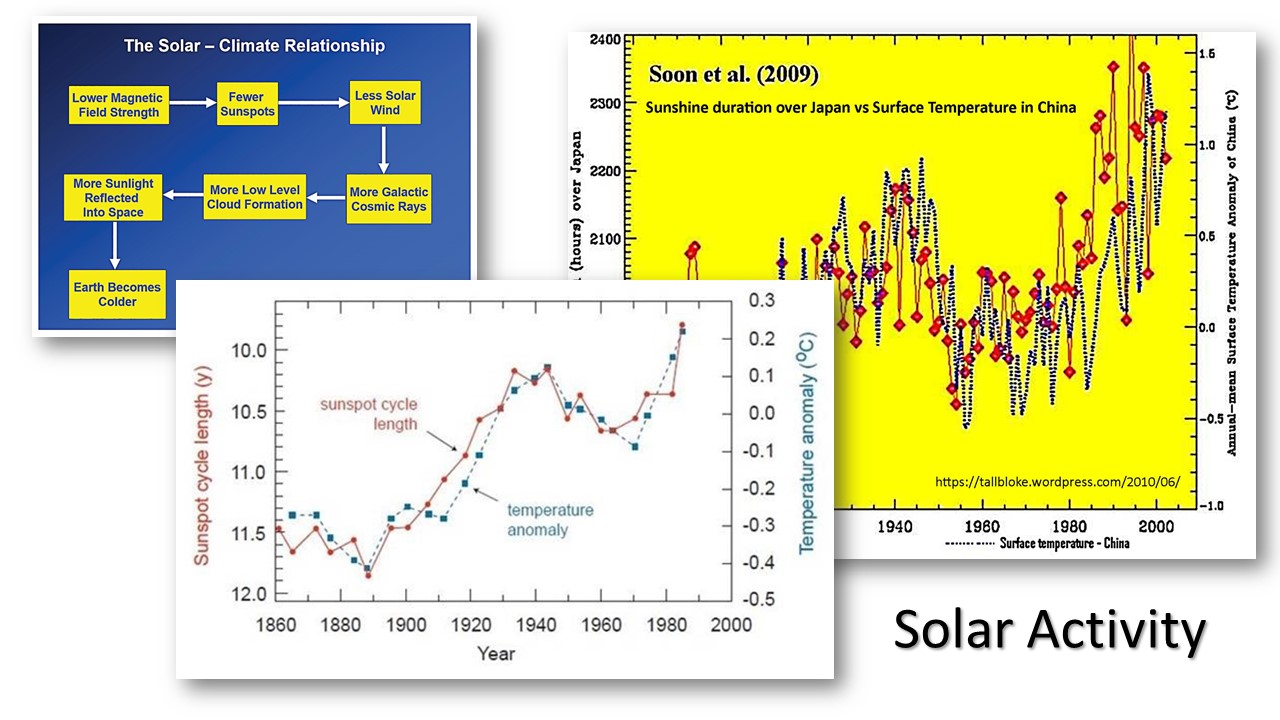
The diagram on the left shows the amazing progression from magnetic field to sunspots, to solar wind to cosmic rays to low altutude cloud formation. It is an area of investigation that has proven to be quite interesting, but at the same time has been faught by the AGW organizations, denying funding and publications.
Clearly the simple model below on sunspot and temperature shows that the solar variability should be taken into consideration, which the GCM’s do not.
Soon has shown that this is true, but the IPCC ignores him. The yellow background curve on the right is a relationship betwween lenght of day and surface temperature.
NEXT: There is another model formulation and analysis that is a good fit to temperature.
The topics cover a wide range of material on the GCM climate models.
Alternative Models Last Century