Patrick Michaels on GCM Models
December 15, 2015
….
There are four different analyses of these datasets, and the blue dots in Figure 1 are their running mean average.
The temperature of the mid-troposphere can also be sensed from above, by orbiting satellites that measure the vibration of diatomic oxygen, which turns out to be a much more accurate thermometer than, say, a standard mercury-in-glass instrument. There are several global analyses of these data, one by Christy’s crew, another from Remote Sensing Systems, a California consultancy, and a third by the U.S. National Oceanic and Atmospheric Administration. The green squares in Figure 1 are the average of these three datasets.
Note that the satellite and balloon-sensed temperatures are independent observational measurements.
The red line in Figure 1 is the five-year running mean of the average of 102 computer model simulations that generate temperatures in this layer, compiled in the latest (2013) scientific assessment of the UN’s Intergovernmental Panel on Climate Change.
All of the data have been scaled the same in the vertical dimension, with a maximum weighting around 12,000 feet above the surface. The sensing technique in the satellite picks off a bit of data above the troposphere, in the placid stratosphere, and the balloon and computer model data were scaled in the same fashion. So this is a true apples-to-apples-to-apples test.
What’s the advantage of looking at these temperatures versus those at the surface?
Rain and snow are largely dependent upon the temperature difference between the surface and the mid-troposphere. When there’s little difference, air in the lower atmosphere does not rise, meaning that the vertical motion required to form a cloud is absent. When the difference is large, moisture laden surface air is very buoyant and can result in intense rain events.
Getting the vertical difference systematically wrong in a climate model means getting the rainfall wrong, which pretty much invalidates regional temperature forecasts. A dry surface (think: desert) warms (and cools) much more rapidly than a wet one. If the computer models are somehow getting surface temperatures right that could only be a fortuitous result if the mid-tropospheric temperatures are as far off as Christy’s data shows.
Indeed, the models have this temperature differential dead wrong. Over the period of study, they say it should be increasing only very slightly. But, in fact, in the real world it is growing at a rate nine times what is predicted by the models over this study period.
Which brings us to those surface temperatures.
They’re a bit slipperier than the mid-tropospheric ones. The laboratories responsible for the three principal histories keep changing history, much more frequently than the satellite or balloon records are reconfigured.
At Cato’s Center for the Study of Science our investigations have led us to the hypothesis that the anthropogenic influence on the earth’s climate—specifically through emissions of greenhouse gases—is near the low end of the “mainstream” (e.g., IPCC) assessed range of influence. And further, that models developed to simulate the behavior of the earth’s climate have generally overestimated the influence of anthropogenic greenhouse gas emissions. Our new book, Lukewarming: The New Science That Changes Everything details the latest scientific findings supporting a complex, yet modest human impact on the earth’s climate.
At last December’s Fall Meeting of the American Geophysical Union (AGU), we summarized our thinking on the issue in a presentation titled “Quantifying the Lack of Consistency between Climate Model Projections and Observations of the Evolution of the Earth’s Average Surface Temperature since the Mid-20th Century.” It reflected the state (at that time) of our continual updates to work originally presented to Congress in 2009, expanded upon at the Third Santa Fe Conference on Global and Regional Climate Change in 2011, written up into a paper, presented at the AGU’s Science Policy Conference in 2013, and regularly updated in comments on national and international climate change assessments and proposed federal regulations designed to restrict greenhouse gas emissions.
The work is a straightforward demonstration that climate models project a greater rise in the global average temperature than has been experienced, one avoids the pitfalls of other types of comparisons and is immune from claims of cherry-picking, as it includes all time periods since 1950 ending in the present. Accompanying this demonstration of model infidelity, we present a case that a major part of the reason that climate models run too hot is that the earth’s equilibrium climate sensitivity is substantially less than portrayed by the climate models. We will revisit this at the end of this paper. Everyone by now is familiar with the “pause” or “slowdown” in the rate of global warming that has taken place over the past 20 years of so, but few realize is that the observed warming rate has been beneath the model mean expectation for periods extending back to the mid-20th century—60+ years. We demonstrate this fact with our comparison of the observed warming rate to that of the range of climate model-predicted warming rates for all periods from 1951 ending with the most recent available data. In our AGU presentation, we included the observations of the global average surface temperature compiled by the UK’s Hadley Center. The Hadley Centre compilation has long been preferred by the IPCC.
And while the Hadley Centre’s surface temperature compilation is not the only one, its recent behavior is more consistent with the low rates of warming being revealed in the mid-tropospheric compilations, in which a substantial amount of the overall data is in fact below approximately 12,000 feet. Here, we add the other two major compilations, from NASA and the Department of Commerce’s National Oceanic and Atmospheric Administration. We’ve also included two less prominent surface temperature compilations from Cowtan and Way (2013) and Berkeley Earth, inclusions which do little more than demonstrate their overall similarity (Figure 2). We have also updated our AGU presentation with our best guess for 2015 average temperatures. Thanks, in part, to a strong El Niño, 2015 is going to be the warmest year in any of the surface temperature compilations. You can see from Figures 1 and 2, however, that this warmth does very little to narrow the disparity between the predicted and observed temperatures.
…
Several of these research findings were published subsequent to the 2013 release of the IPCC’s Fifth Assessment Report (AR5), and thus were not included in that Assessment. Others were considered in the IPCC AR5, and still others were ignored. And while the IPCC AR5 did reflect some influence on these new low ECS estimates—by expanding its “likely” range of ECS estimates downward to include 1.5°C (the low end was 2.0°C in the 2007 IPCC Fourth Assessment Report) and omitting a “best estimate” value (which had previously been given as 3.0°C in the 2007 report)—it still doggedly held on to its high end “likely” estimate of 4.5°C. This was a disservice to the latest science, but was a necessary step to preserve the IPCC’s reliance on climate projections made by models with an ECS averaging 3.2°C and ranging from 2.1°C to 4.7°C—the same models recently evaluated by Christy and in our AGU presentation. Had the IPCC fully embraced an ECS near 2.0°C—that which the recent literature suggests—it would have had to throw out much of the rest of the report. We explained the IPCC’s conundrum in this post on Cato’s blog. A more detailed and extremely compelling report on how the IPCC should have handled the new ECS findings was put together by the Global Warming Policy Foundation. Any serious examination of the extant ECS literature would be remiss not to carefully consider the content of the GWPF report (which convincingly argues for an ECS of 1.75°C or even a bit lower).
One may argue that ECS estimates based upon one or two centuries of observations may not fully capture very long-term climate responses, and that therefore such ECS estimates are likely too low. While the magnitude (or even the existence) of the underestimate is difficult to assess, what is certain is that whatever the influence may be, it is only fully manifest on timescales far beyond even multiple human generations. In other words, when attempting to assess the coming climate changes over the next century or so, observationally based ECS estimates—estimates derived directly from the extant temperature histories both of the surface temperature as well as oceanic heat content—are very appropriate. This is even more so for estimates of the “transient” climate sensitivity—the temperature rise at the time of a doubling of the atmospheric CO2 concentration, as that is likely to occur sometime in the second half of this century, before the ECS is realized. Again, the recent estimates from real world behavior of the atmosphere and ocean are far beneath climate model expectations; see the GWPF report for a recent round-up.
That the actual ECS (at least as assessed over century times scales) is likely much lower than the average value of the climate models incorporated in the IPCC’s AR5 is an efficient explanation for why climate models tend to over predict the amount of global warming which has taken place—which has huge significance in assessing the utility of climate model projections for future climate change. Based upon these and other lines of evidence (laid out in our numerous scientific publications, books, blogs articles, social media (see publications listed here and here for example)), we conclude that future global warming will occur at a pace substantially lower than that upon which US federal and international actions to restrict greenhouse gas emissions are founded.
It is high time to rethink those efforts.
We should revisit occasionally what the proper role of government is. As the constitution was a good sense of direction, we need a core set of principles to add in order to deal with the future.
So many want to engineer society, remove risk, assist certain groups, rather than let individuals thrive and raise communities. Why?
Is Democracy where we all "get it good and hard" or is it the best means to a free society?
Should we roll with the special interests, or make the government achieve its proper role, what is that role, and how to do this?
When do deficits and governments become too large?
Government is becoming more elitist while trying to sell corrections to problems it created, what makes this possible?
GCM Model Errors estimate of the large error
GCM Model Results The results of the IPCC
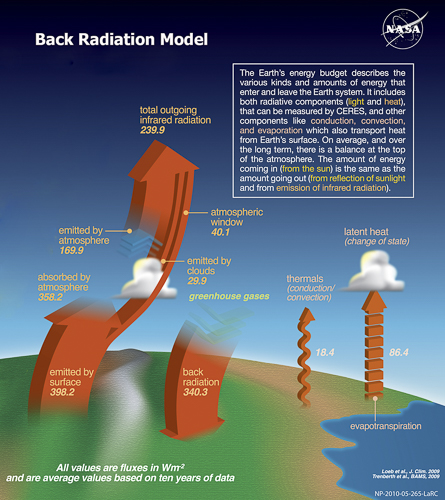
GCM do not model Convection Well
Patrick Michaels on GCM Models