Climate Drivers Alternative Model
The alternative model below is one of the alternative models to the GCM for the past century. Hard to beat these correlation numbers for 14 temperature datasets. Using a solar variable, water vapor, and ocean cycles they show excellent correlation without any CO2 driver component required.
Global Climate Drivers Article Link
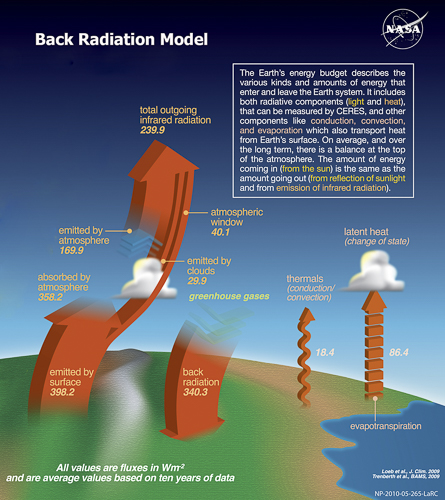
Water vapor is the ghg which makes earth warm enough for life as we know it. Increased atmospheric water vapor contributes to planet warming. Water vapor molecules are far more effective at absorbing terrestrial thermal radiation than CO2 molecules (even if thermalization did not eliminate CO2 as a significant warmer). Humanity’s contribution to atmospheric water vapor increase is primarily (≈ 98%) as a result of increased irrigation, with comparatively tiny contributions from cooling towers at electricity generating facilities, and increased burning of hydrogen rich fossil fuels especially natural gas which is nearly all methane. Switching to ‘renewables’ will have no significant effect on climate.
Because water vapor is a ghg, increased water vapor causes the planet to warm which further increases water vapor so there is a cumulative effect (in control system analysis and electric circuit analysis as done by engineers, this is called feedback and is quantified by a dimensionless number. The term ‘feedback’ has a different meaning to Climate Scientists and is quantified in units of W/m2). This cumulative effect also amplifies cooldown.
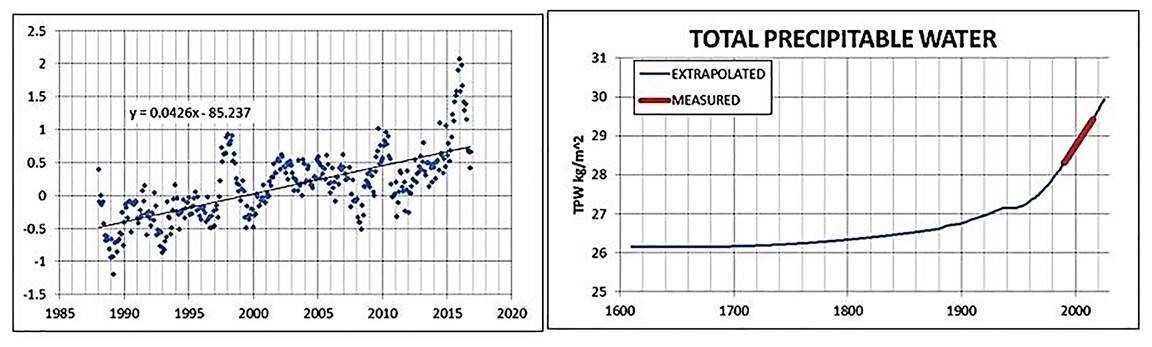
Planet warming associated with the proxy of sunspot number anomaly time-integral, as discussed later, increases the vapor pressure of water contributing to the water vapor increase. At present, (thru April 2017) water vapor appears to be increasing about three times faster than expected based on AGT increase alone. Global temperature increase in a decade from HadCRUT4, discounting el Nino is about 0.08 K. At 15°C increase in water vapor partial pressure is 6.25% per degree. Percent increase in water vapor due to temperature increase = 0.08 * 6.25% = 0.5%. Measured % increase from TPW in 28 yr = (29.5-28.25)/28 = 0.044 = 4.4%. In 10 yr = 10/28*4.4 = 1.57%. Thus measured increase in WV is about 1.57/.5 = 3+ times that for temperature increase alone.
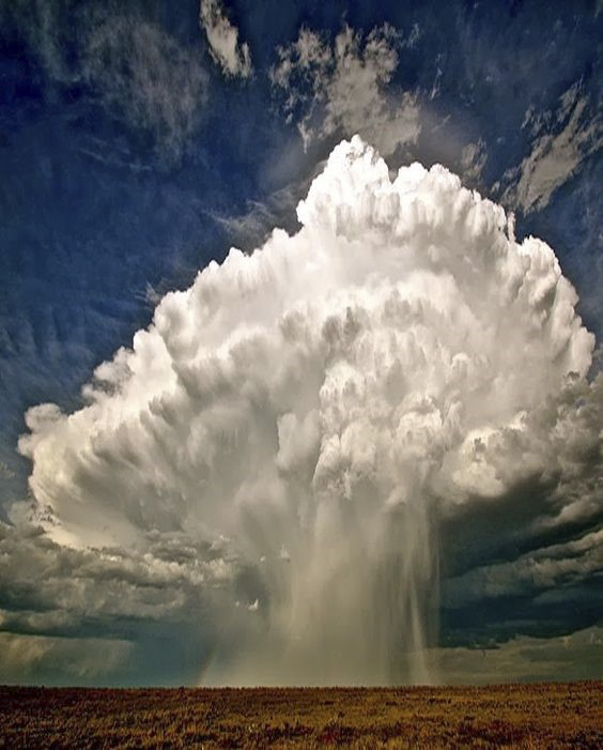
The increased water vapor also causes increased cloud cover which is a negative feedback on temperature. Water vapor exhibits a logarithmic decline in absorption effect of equal added increments of water vapor (Fig. 3 of Ref. [12]).
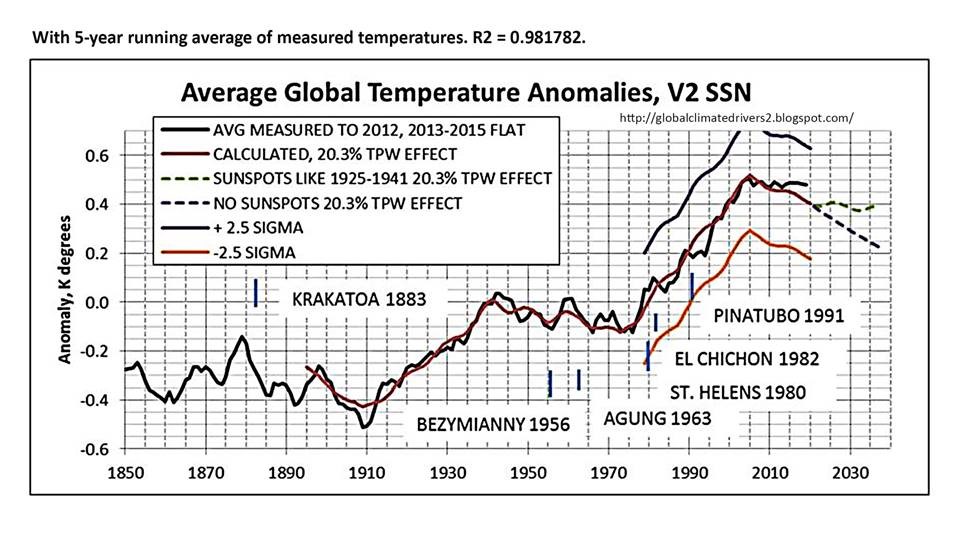
Below Fig 11: With 5-year running average of measured temperatures. R2 = 0.981782
Three factors explain essentially all of AGT change since before 1900. They are ocean cycles, accounted for with an approximation, influence quantified by a proxy which is the SSN anomaly time-integral and, the gain in atmospheric water vapor measured since 1987 and extrapolated before and after using measured CO2 as a proxy.
Others have looked at only amplitude or only duration factors for solar cycles and got poor correlations with average global temperature. The excellent correlation comes by combining the two, which is what the time-integral of sunspot number anomalies does. Prediction of future sunspot numbers more than a decade or so into the future has not yet been confidently done.
As displayed in Figure 12, the β-trend shows the estimated true average global temperature trend (the net average global energy trend) during the planet warm up from the depths of the Little Ice Age.
The net effect of ocean oscillations is to cause the surface temperature α-trend to oscillate above and below the β-trend. Equation (1) accounts for both trends.
Figure 11 shows the near perfect match with calculated temperatures which occurs when random fluctuation in reported measured temperatures is smoothed out with 5-year moving average.
Warming attributed to increasing water vapor explains the flat measured AGT trend in spite of declining sunspot and ocean cycle forcings and might delay or even prevent global cooling.
The increasing trend of global average water vapor as shown in Figure 3, besides countering the temperature decline which would otherwise be occurring, is a likely contributor to increased precipitation and flooding.
Long term prediction of average global temperatures depends substantially on long term prediction of sunspot numbers.
We should revisit occasionally what the proper role of government is. As the constitution was a good sense of direction, we need a core set of principles to add in order to deal with the future.
So many want to engineer society, remove risk, assist certain groups, rather than let individuals thrive and raise communities. Why?
Is Democracy where we all "get it good and hard" or is it the best means to a free society?
Should we roll with the special interests, or make the government achieve its proper role, what is that role, and how to do this?
When do deficits and governments become too large?
Government is becoming more elitist while trying to sell corrections to problems it created, what makes this possible?
This is a list of pages with related content.