US Climate and Pacific Ocean Cycle
A climate researcher at Cornell University, Remy Mermelstein has written an interesting and provocative paper showing the linkage between the Pacific Decal Oscillation (PDO) and the climate swings in the United States on a region by region basis. The results of the study can be summed up in one graph: (click to enlarge)
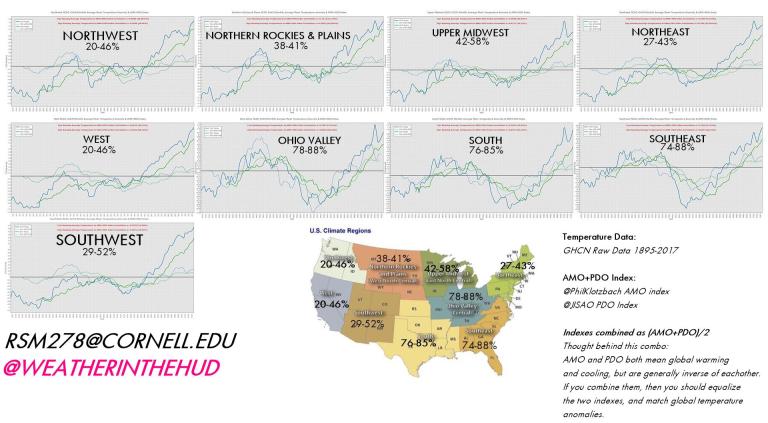
This paper aims to identify and discuss the sensible weather trends in each of the ten climate regions of the U.S. affected by the natural oscillations representing the Pacific Decadal Oscillation (PDO) and the Atlantic Multi-Decadal Oscillation (AMO). By finding the correlations between the natural oscillations and the sensible weather, we can create composites and learn about their tendencies to better aid in forecasting the weather.
The importance of the different modes of each oscillation has been found to vary among each of the climate regions of the U.S, as defined by the National Centers for Environmental Information (NCEI) (Karl, T. R. & Koss W. J., 1984) – Northwest, West, Southwest, Northern Rockies and Plains (West North Central), Upper Midwest (East North Central), South, Ohio Valley (Central), Southeast, and Northeast.
It has been found that the different regions tend to be influenced differently by each of the oscillations and their modes, thus leading to variances in the regional sensible weather experienced in each mode’s time series. The most obvious effect on sensible weather that the AMO and PDO have can be seen from the temperature curves that are quite visible on the temperature time series (Kurtz, 2015).
These indicate that the 1940-1978 decrease in CONUS temperatures was caused more by the negatively trending oscillatory modes of the AMO/PDO than other factors, and the 1978-2001 increase in temperatures was caused more by the positively trending oscillatory modes of the same oscillations. The small increase, or rather stagnant nature in U.S. CONUS temps since 2001, was likely due to peaking positive modes of the AMO/PDO. In the same way that the AMO and PDO can modify the regional temperatures, we see the same types of effects on precipitation, snowfall and drought in the different regions of the U.S.
Just as the sun rises and sets each day, thereby modifying our daily diurnal and nocturnal temperature cycles, the oceans also cycle and change on a regular and quite predictable time scale. On a daily, monthly, yearly and decadal scale, the oceans go through periods of warming and cooling on a large scale as the meridional overturning circulation (MOC) does its work transporting the oceans water around the world. Gilbert Walker has been recognized as one of the first to identify these periods of warming and cooling as oscillations, and oscillations that then have a profound effect on the weather trends across the globe, as early as 1908 (D’Aleo & Easterbrook, 2011). It was not until the late 1960s when these oscillations were first found to be statistically significant, and the weather community began to use them to predict and identify worldwide climate trends.
It was not until 2003 (Anastasios, Swanson, & Kravtsov, 2003, 2007) that models were created that suggested that these cycles, namely the Pacific Decadal Oscillation (PDO) and the Atlantic Multidecadal Oscillation (AMO) synchronized with each other. Using this as a base, we can explain the major climate shifts that have occurred since scientists began collecting data in the late 1800’s: 1908, 1932, 1973, and 2000. While the most noticeable change in these shifts was on global temperature, effects on the regional, sensible weather in the U.S. were also identified in these same time frames. Through analysis it has been theorized that these shifts are caused by the oceans, and are in fact the main drivers of the climate, and the sensible weather experienced in the United States (Klotzbach & Gray, 2009).
The PDO was first hinted at during the great climate shift/regime change in the Pacific Basin in the early to mid-1970s, and during a study conducted by scientists at NOAA to figure out why salmon fishing would go through 30 year cycles of amazing yields and not so amazing yields. Mantua et al., (1997) found that the PDO is essentially a long-lived El Niño-like pattern of the Northern Pacific Climate variability. While the two different oscillations have similar spatial climate fingerprints in terms of their effects, they have very different timescales and behaviors over time. (Mantua, Hare, Zhang, Wallace, & Francis, 1997).
TThe PDO “events” have been found to persist for 20-30 year periods, which distinguishes them from the ENSO events, which typically persist for 6-18 months. In addition, while the canonical ENSO events are recognized to be spatially in the equatorial Pacific, the canonical PDO events are recognized to be visible in the North Pacific, specifically 30-50°N, 150°E-150°W.
The PDO index (Fig 1) is created within this spatially defined area and then subtracted from the global mean anomaly from each NPAC grid point in the files used (Mantua, Hare, Zhang, Wallace, & Francis, 1997). During a negative (-) phase, we see a warm North Central Pacific, with a cold ring around the East Pacific from the equatorial regions up the West US Coast and the Gulf of Alaska (GOA). During the opposite, a warm positive (+) phase, we see a cool North Central Pacific, with a warm ring around the East Pacific from the equatorial regions up the West US Coast and the GOA.
The Atlantic Ocean, like the Pacific, has its own oscillation – the AMO (Fig 2). It too exhibits tendencies and characteristics like the PDO, with 20-30 year cycles when the Atlantic is in warm or cold periods. The AMO is calculated in the North Atlantic. During a positive AMO event we recognize a warm ring of sea surface temperatures (SSTs) in the tropical North and Far North Atlantic, with relatively cool temperatures in the West Central Atlantic basin. When the ocean flips into the opposite cold negative phase we see cold SSTs in the tropics and Far North Atlantic, with a warm west central ocean. While the widely recognized AMO dataset from NCEP is the average SST anomaly standardized from 0-70N; 75W-10W, for the purposes of this paper it was decided to use the lotzbach and Gray (2008) index, which is formulated as follows: AMO/THC = [(SSTA+SA)-SLPA], or, NATL SSTA + Salinity Anomaly (SA) in the regions (50- 65°N; 50°W-10°W) minus the SLPA anomaly in the region (0-50°N; 70°W-10°W). In our opinion
tthis dataset yields a more accurate picture of what we think the AMO is, which is not just SSTs in the N Atlantic, but rather the relationship between the AMO and the Thermohaline Circulation
(Klotzbach & Gray, 2009), which includes the pressure anomalies, further helping to identify effects on sensible weather in the CONUS.
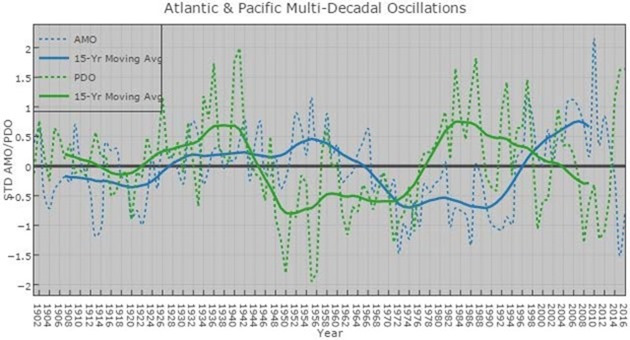
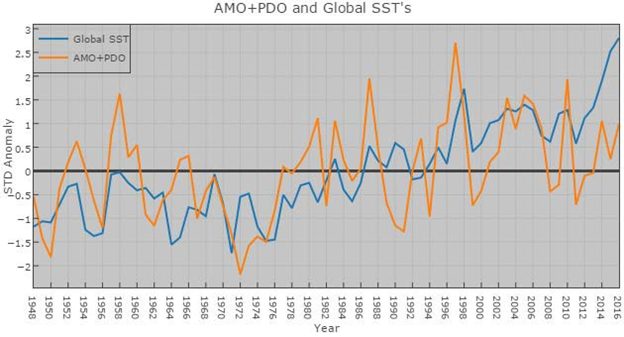
Within the corresponding time periods of the datasets used, it has been found that the AMO typically lags the PDO by 10-15 years (Fig 3), especially in recent years. In the period 1910-1950 they were much closer, with a correlation of 0.76 (76%) within the dataset. The correlation has decreased dramatically, in fact inversed, with a -0.49 (-49%) correlation value for the period 1950- Present. This may be due to dataset changes, with more accurate data in the later years, or it may be a function of the oscillation itself diverging. In any case, something like the current pause in contiguous U.S. warming today (and from 1932-1973) or the decadal drought periods and cyclical snowfall maximums, may be explained with the same root cause – these regular changes in the SSTs that we refer to as PDO and AMO.
The entire paper is available here from DropBox: https://.co/cbZqMHSYxR
I found this graph quite interesting:
We should revisit occasionally what the proper role of government is. As the constitution was a good sense of direction, we need a core set of principles to add in order to deal with the future.
So many want to engineer society, remove risk, assist certain groups, rather than let individuals thrive and raise communities. Why?
Is Democracy where we all "get it good and hard" or is it the best means to a free society?
Should we roll with the special interests, or make the government achieve its proper role, what is that role, and how to do this?
When do deficits and governments become too large?
Government is becoming more elitist while trying to sell corrections to problems it created, what makes this possible?
This could also be inserted into the field above, or erased
Currently as a society, we are having a most difficult time discussing political issues. What is driving this? And why a rebirth in political culture would be a good thing.
Are "markets" dead as some would conjecture? Or is free enterprise what got us here?
At the heart of economics there are several possible economic schools of thought, the essence of these schools of thought and how they relate to our lives.