Geothermal Heat and Surface Temps
By Kenneth Richard on 22. May 2017
It has long been established in the peer-reviewed scientific literature that naturally-driven fluctuations in the Earth’s surface temperature preceded the rise and fall of carbon dioxide (CO2) concentrations for at least the last 800,000 years.
As oceans warm, they release more of their vast stores of CO2; as oceans cool, they retain more CO2. During cold glacial periods, when ice sheets covered much of the Earth, atmospheric CO2 concentrations only hovered around 180 parts per million (ppm). After surface temperatures naturally warmed up by multiple degrees C during Interglacials, it took at least several hundred years before atmospheric CO2 concentrations began rising in response to the temperature rise.
This lag supports the conclusion that glacial-to-interglacial variations in CO2 concentrations may be driven by temperature changes, as the temperature change occurred well before the CO2 change did.
IPCC AR4 (2007): “Atmospheric CO2 follows temperature changes in Antarctica with a lag of some hundreds of years.”
Caillon et al., 2003 “The sequence of events during Termination III suggests that the CO2 increase lagged Antarctic deglacial warming by 800 ± 200 years and preceded the Northern Hemisphere deglaciation.”
Fischer et al., 1999 “High-resolution records from Antarctic ice cores show that carbon dioxide concentrations increased by 80 to 100 parts per million by volume 600 ± 400 years after the warming of the last three deglaciations.”
Monnin et al., 2001 “The start of the CO2 increase thus lagged the start of the [temperature] increase by 800 ± 600 years.”
Kawamura et al., 2007 “Our chronology also indirectly gives the timing of the CO2 rise at [glacial] terminations, which occurs within 1 k yr of the increase in Antarctic temperature.”
Indermuhle et al., 2000 “The [CO2] lag was calculated for which the correlation coefficient of the CO2 record and the corresponding temperatures values reached a maximum. The simulation yields a [CO2] lag of (1200 ± 700) yr.
Landais et al., 2013 “[F]rom 130.5 to 129,000 years ago, the rise in atmospheric CO2 concentrations lagged that of Antarctic temperature unequivocally….At mid-slope, there is an unequivocal lead of δ15N [temperature] over CO2 of 900 ± 325 yr”.
Schneider et al., 2013 “Furthermore, a 5,000 yr lag in the CO2 decline relative to EDC [East Antarctica] temperatures is confirmed during the glacial inception at the end of MIS5.5 (120,000 yrs before present).”
Stott et al., 2007 “Deep-sea temperatures warmed by ∼2°C between 19 and 17 thousand years before the present (ky B.P.), leading the rise in atmospheric CO2 and tropical–surface-ocean warming by ∼1000 years.”
The occurrence of temperature change leading the CO2 concentration growth rate change may also occur in the modern era.
Flohn, 1982 “Comparative investigations (Keeling and Bacastow 1977, Newll et al. 1978, Angell 1981) found a positive correlation between the rate of increase of atmospheric CO2 and the fluctuations of sea surface temperature (SST) in the equatorial Pacific, which are caused by rather abrupt changes between upwelling cool water and downwelling warm water (“El Niño“) in the eastern equatorial Pacific. … A crude estimate of these differences is demonstrated by the fact that during the period 1958-1974, the average CO2-increase within five selective years with prevailing cool water only 0.57 ppm/a [per year], while during five years with prevailing warm water it was 1.11 ppm/a. Thus in a warm water year, more than one Gt (1015 g) carbon is additionally injected into the atmosphere, in comparison to a cold water year.”
Jones and Cox, 2005 “There is clear similarity between Figures 1b and 1c, with the positive CO2 growth rate anomalies corresponding to El Niño [warming] events, and the negative growth rate anomalies corresponding to La Niña [cooling] events. … It is unlikely that these anomalies can be explained by an abrupt increase in anthropogenic emissions, as the anomalies are much larger than annual increases in fossil fuel emissions. Most inter-annual variability in the CO2 growth rate is attributable to variations in land-atmosphere CO2 exchange with climate (e.g., associated with ENSO or volcanic perturbations)”
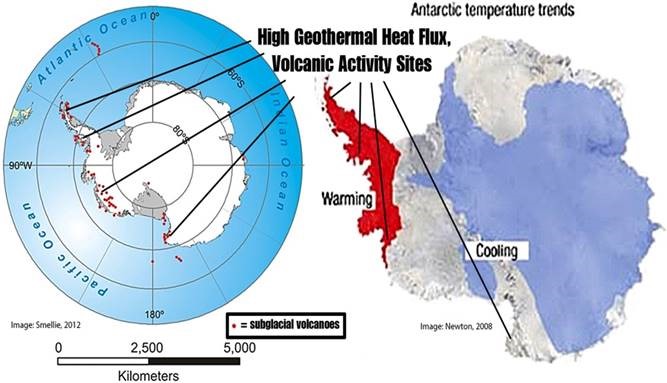
It has recently been suggested that there is a “detection of Milankovitch [millennial-scale climate changes linked to the Earth’s orbit] frequencies in global volcanic activity” (Kutterolf et al., 2012), or that variations in geothermal or volcanic activity are not random, but function within short- and long-term cycles and periodicities that could be linked to the Sun-Earth connection itself.
Tolstoy, 2015 “Pulsing of seafloor volcanic activity may feed back into climate cycles, possibly contributing to glacial/interglacial cycles, the abrupt end of ice ages, and dominance of the 100 kyr cycle.”
With this in mind, it should not be particularly surprising that Russian geophysicists Demezhko and Gomostaeva (2015) recently found the geothermal heat flux from below the Earth’s surface may have risen 2 to 3 thousand years before the surface temperatures and CO2 concentrations began rising.
Demezhko and Gornostaeva, 2015 “Despite the substantial dispersion of CO2 estimations, a character and a chronology of CO2 concentration changes are much closer to temperature changes rather than to heat flux variations. It may mean no significant contribution of CO2 forcing to climatically caused heat flux and thus to the temperature increase during Pleistocene–Holocene warming.”
“[T]he increase of carbon dioxide may be a consequence of temperature increasing. Comparing the chronology of surface flux, temperature and carbon dioxide concentration changes, we can draw some conclusions about the causes of climate change. … The increase of carbon dioxide concentrations occurred 2–3 thousands of years later than the heat flux increase and synchronously with temperature response.”
Therefore, the order for net heat energy changes in the Earth system may be this: First, there is (a) a change (increase) in the heat flux from beneath the Earth’s surface (with an ostensible connection to solar-orbital changes), (b) the Earth’s surface temperature rises, and (c) CO2 concentrations rise.
We should revisit occasionally what the proper role of government is. As the constitution was a good sense of direction, we need a core set of principles to add in order to deal with the future.
So many want to engineer society, remove risk, assist certain groups, rather than let individuals thrive and raise communities. Why?
Is Democracy where we all "get it good and hard" or is it the best means to a free society?
Should we roll with the special interests, or make the government achieve its proper role, what is that role, and how to do this?
When do deficits and governments become too large?
Government is becoming more elitist while trying to sell corrections to problems it created, what makes this possible?
This could also be inserted into the field above, or erased
Currently as a society, we are having a most difficult time discussing political issues. What is driving this? And why a rebirth in political culture would be a good thing.
Are "markets" dead as some would conjecture? Or is free enterprise what got us here?
At the heart of economics there are several possible economic schools of thought, the essence of these schools of thought and how they relate to our lives.