US Monthly Averages
Slide 2 in this series.
This trend for the USA of absolute temperature on an average monthly basis shows the high temperature difference between max and min while the averages do not change much.
Of course this is not a display of anomalies as seen on other slides. This is obviously absolute temperature for comparison.
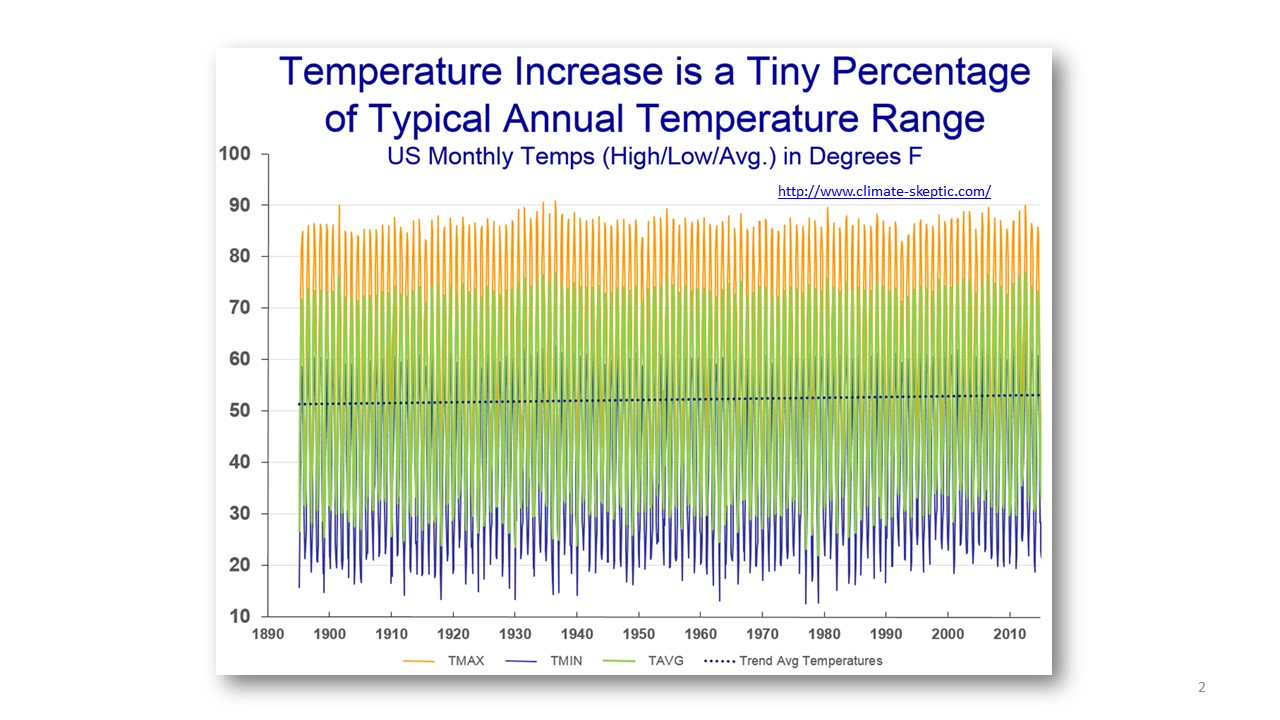
The variation for the avg US across a short time is 14 to 85F, or -9 to 29C. A span of 38C. Tmax vs Tmin and the Tavg: accuracy begins with the accuracy of the measurement. Observe the well behaved average line in the middle. It is hard to process the graph visually into anomaly temp.
NEXT: What do the various temperature datasets look like and how well do they represent the variation in temperature?
A full range of topics on how global temperature works, is reported, adjusted, and some insignts into its accuracy.