Rise in CO2 occurs with Rise in T
Guest post by Lon Hocker
A commonly seen graph illustrating what is claimed to be a causal correlation between CO2 and temperature, with CO2 as the cause. (Image courtesy Zfacts.com)
Differentiating the CO2 measurements over the last thirty years produces a pattern that matches the temperature anomaly measured by satellites in extreme detail. That this correlation includes El Niño years, and shows that the temperature rise is causing the rise in CO2, rather than the other way around. The simple equation that connects the satellite and Mauna Loa data is shown to have a straight forward physical explanation.
The last few decades has shown a heated debate on the topic of whether the increase of CO2 in the atmosphere is causing rising temperatures. Many complex models have been made that seem to confirm the idea that anthropological CO2 is responsible for the temperature increase that has been observed. The debate has long since jumped the boundary between science and politics and has produced a large amount of questionable research.
“Consensus View”
Many people claim that anthropological CO2 is the cause of global warming. Satellite temperature data, http://vortex.nsstc.uah.edu/data/msu/t2lt/uahncdc.lt, and Mauna Loa CO2 measurements, ftp://ftp.cmdl.noaa.gov/ccg/co2/trends/co2_mm_mlo.txt, are well accepted and freely available to all researchers. Figure 1 shows a plot of the Ocean Temperature Anomaly from the satellite data shows a general rising trend. Shown along with the temperature data is a simple linear model showing the temperature rise as a linear function of CO2 concentration. This shown linear model is:
Temperature Anomaly = (CO2 -350)/180
No attempt has been made to optimize this model. Although it follows the general trend of the temperature data, it follows none of the details of the temperature anomaly curve. No amount of averaging or modification of the coefficients of the model would help it follow the details of the temperature anomaly.
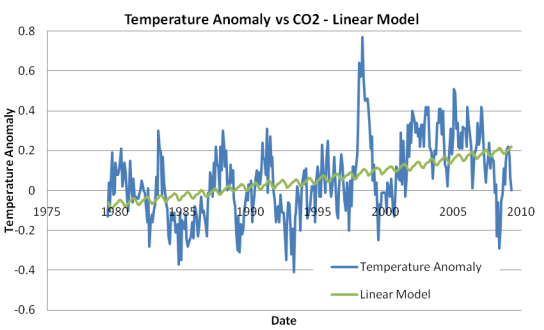
Figure 1: Ocean Temperature Anomaly and linear CO2 model
An alternate approach that does show these details is that the temperature anomaly is correlated with the rate of increase of CO2. I discovered this independently and roughly simultaneously with Michael Beenstock and Yaniv Reingewertz http://economics.huji.ac.il/facultye/beenstock/Nature_Paper091209.pdf.
Applying this model to the Mauna Loa data not only shows the overall trend, but also matches the many El Niño events that have occurred while satellite data has been available. The Figure 2, shows the derivative model along with the observed Ocean Temperature Anomaly. The model is simply
Temperature Anomaly = (CO2(n+6) – CO2(n-6))/(12*0.22) – 0.58
where ‘n’ is the month. Using the n+6 and n=6 values (CO2 levels six months before and six months after) cancels out the annual variations of CO2 levels that is seen in the Mauna Loa data, and provides some limited averaging of the data.
The two coefficients, (0.22 and 0.58) were chosen to optimize the fit. However, the constant 0.58 (degrees Celsius) corresponds to the offset needed to bring the temperature anomaly to the value generally accepted to be the temperature in the mid 1800’s when the temperature was considered to be relatively constant. The second coefficient also has a physical basis, and will be discussed later.
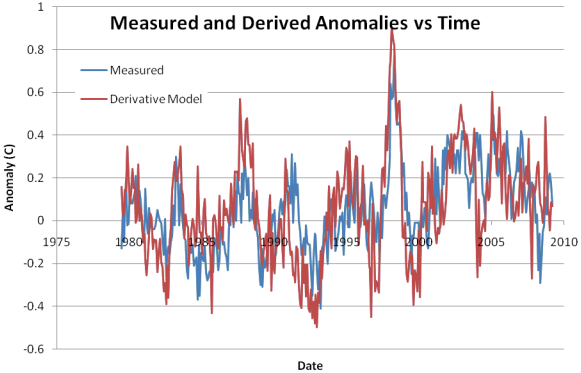
Figure 2: Ocean Temperature Anomaly and derivative CO2 model
There is a strong correlation between the measured anomaly and the Derivative model. It shows the strong El Niño of 1997-1998 very clearly, and also shows the other El Niño events during the plotted time period about as well as the satellite data does.
El Niño events have been recognized from at least 1902, so it would seem inappropriate to claim that they are caused by the increase of CO2. Given the very strong correlation between the temperature anomaly and the rate of increase of CO2, and the inability to justify an increase of CO2 causing El Niño, it seems unavoidable that the causality is opposite from that which has been offered by the IPCC. The temperature increase is causing the change in the increase of CO2.
It is important to emphasize that this simple model only uses the raw Mauna Loa CO2 data for its input. The output of this model compares directly with the satellite data. Both of these data sets are readily available on the internet, and the calculations are trivially done on a spreadsheet.
Considering this reversed causality, it is appropriate to use the derivative model to predict the CO2 level given the temperature anomaly. The plot below shows the CO2 level calculated by using the same model. The CO2 level by summing the monthly CO2 level changes caused by the temperature anomaly.
Month(n) CO2 = Month(n-1) CO2 + 0.22*(Month(n) Anomaly + 0.58)
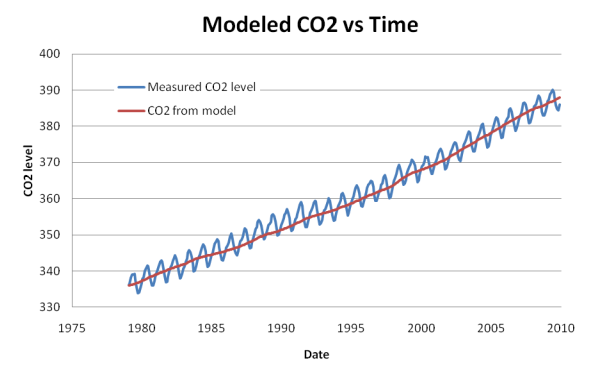
Figure 3: Modeled CO2 vs Observed CO2 over Time
Not surprisingly the model tracks the CO2 level well, though it does not show the annual variation. That it does not track the annual variations isn’t particularly surprising, since the ocean temperature anomaly is averaged over all the oceans, and the Mauna Loa observations are made at a single location. Careful inspection of the plot shows that it tracks the small inflections of the CO2 measurements.
The Mauna Loa data actually goes back to 1958, so one can use the model to calculate the temperature anomaly back before satellite data was available. The plot below shows the calculated temperature anomaly back to 1960, and may represent the most accurate available temperature measurement data set in the period between 1960 and 1978.
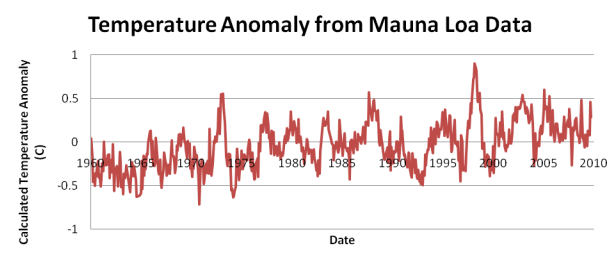
Figure 4: Calculated Temperature Anomaly from MLO CO2 data
Precise temperature measurements are not available in the time period before Satellite data. However, El Niño data is available at http://www.cpc.noaa.gov/products/analysis_monitoring/ensostuff/ensoyears.shtml making it possible to show the correlation between the calculated temperatures and the and El Niño strength. Note that the correlation between temperature anomaly and El Niño strength is strong throughout the time span covered.
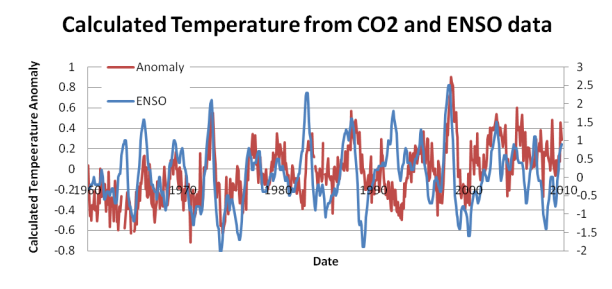
Figure 5: Calculated Temp CO2 from CO2 and ENSO data
The second free parameter used to match the CO2 concentration and temperature anomaly, 0.22 ppm per month per degree C of temperature anomaly, has a clear physical basis. A warmer ocean can hold less CO2, so increasing temperatures will release CO2 from the ocean to the atmosphere.
The Atmosphere contains 720 billion tons of CO2 (http://eesc.columbia.edu/courses/ees/slides/climate/carbon_res_flux.gif), the ocean 36,000 billion tons of CO2. Raising the temperature of the ocean one degree reduces the solubility of CO2 in the ocean by about 4% (http://www.engineeringtoolbox.com/gases-solubility-water-d_1148.html)
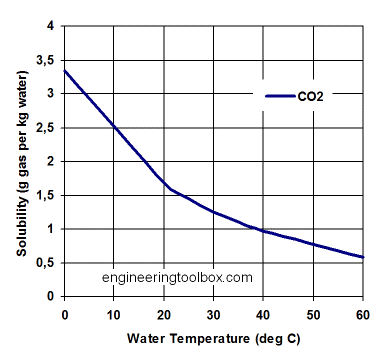
Figure 6: Solubility of CO2 in water (While CO2 solubility in seawater is slightly different than in pure H2O shown above in Figure 6, it gives us a reasonably close fit.)
This releases about 1440 billion tons of CO2 to the atmosphere. This release would roughly triple the CO2 concentration in the atmosphere.
We have seen what appears to be about a 0.8 degree temperature rise of the atmosphere in the last century and a half, but nowhere near the factor of three temperature rise. There is a delay due to the rate of heat transfer to the ocean and the mixing of the ocean. This has been studied in detail by NOAA, http://www.oco.noaa.gov/index.jsp?show_page=page_roc.jsp&nav=universal, and they estimate that it would take 230 years for an atmospheric temperature change to cause a 63% temperature change if the ocean were rapidly mixed.
Using this we can make a back of the envelope calculation of the second parameter in the equation. This value will be approximately the amount of CO2 released per unit temperature rise (760 ppm/C)) divided by the mixing time (230 years). Using these values gives a value of 0.275 ppm /C/month instead of the observed 0.22 ppm/C/month, but not out of line considering that we are modeling a very complex transfer with a single time constant, and ignoring the mixing time of the ocean.
Using two well accepted data sets, a simple model can be used to show that the rise in CO2 is a result of the temperature anomaly, not the other way around. This is the exact opposite of the IPCC model that claims that rising CO2 causes the temperature anomaly.
We offer no explanation for why global temperatures are changing now or have changed in the past, but it seems abundantly clear that the recent temperature rise is not caused by the rise in CO2 levels.
================================================
We should revisit occasionally what the proper role of government is. As the constitution was a good sense of direction, we need a core set of principles to add in order to deal with the future.
So many want to engineer society, remove risk, assist certain groups, rather than let individuals thrive and raise communities. Why?
Is Democracy where we all "get it good and hard" or is it the best means to a free society?
Should we roll with the special interests, or make the government achieve its proper role, what is that role, and how to do this?
When do deficits and governments become too large?
Government is becoming more elitist while trying to sell corrections to problems it created, what makes this possible?
This could also be inserted into the field above, or erased
Currently as a society, we are having a most difficult time discussing political issues. What is driving this? And why a rebirth in political culture would be a good thing.
Are "markets" dead as some would conjecture? Or is free enterprise what got us here?
At the heart of economics there are several possible economic schools of thought, the essence of these schools of thought and how they relate to our lives.