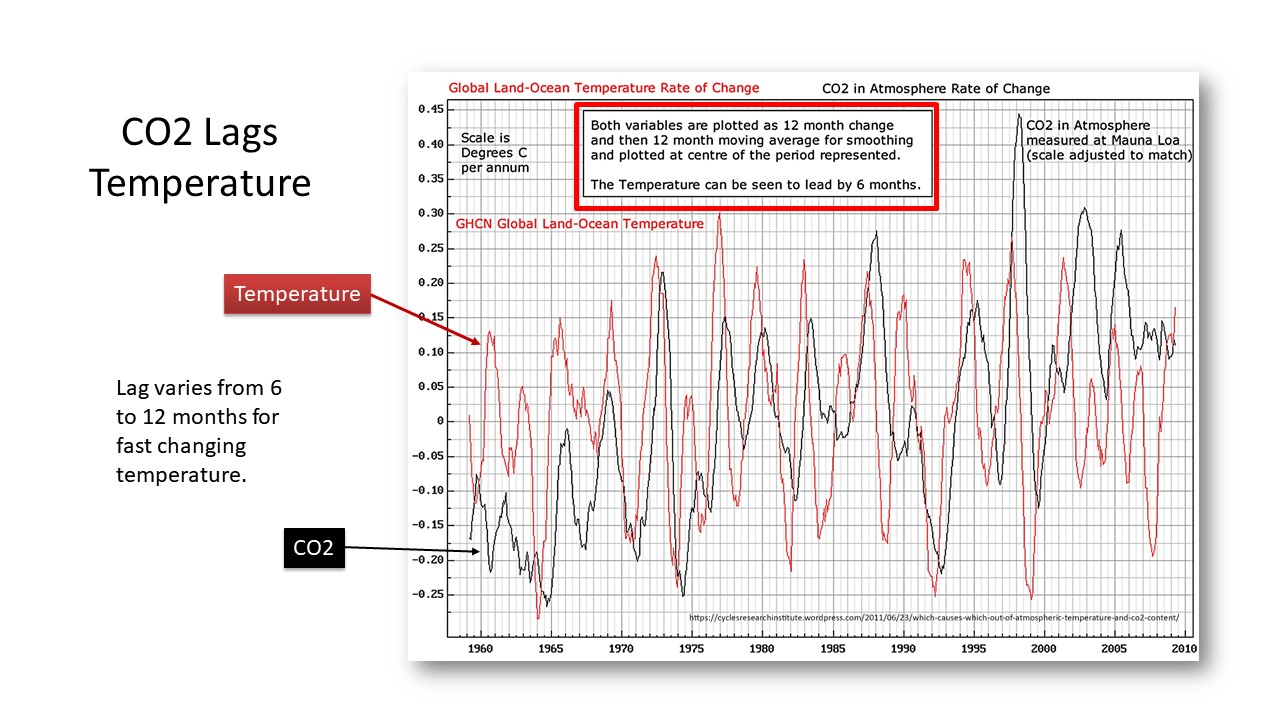
CO2 Lags Temperature
Slide 26 in this series.
In this graph we can see that the temperature leads CO2 by 6 months. Other curves and time periods have also reported CO2 lagging temperature. There is some physics to suggest that this is not just statistical manipulation.
As the oceans warm they release more CO2. Conversely as the oceans cool they absorb more. It therefore makes good sense that this is the case. Longterm ice core analysis can have the CO2 lag temperature by 800 years. Other datasets are closer to the one below that have a number of months difference in time. How temperature and CO2 is determined is critical to the validity of this conclusion. In the case below it does appear that this a valid analysis.
This is a significant finding. If CO2 lags temperature then how can it cause a temperature increase to first order?
NEXT: Furthermore if we look at a scatter plot of CO2 versus Temperature what do we see?
The links below are to the pages or slides in this section, which covers the science of CO2.