Ice Cores NASA Article
Does this affect the Vostok data and all of the data Plimer refers to? Interesting question of many.
David Middleton / March 28, 2017
Guest post by David Middleton
Source: NASA Link
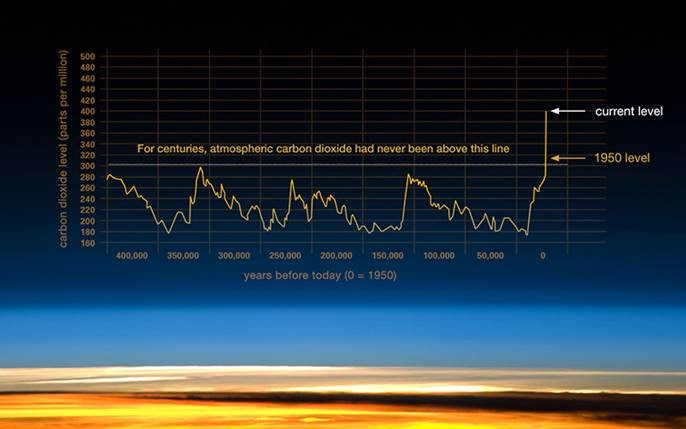
Graphic: The relentless rise of carbon dioxide
Ancient air bubbles trapped in ice enable us to step back in time and see what Earth’s atmosphere, and climate, were like in the distant past. They tell us that levels of carbon dioxide (CO2) in the atmosphere are higher than they have been at any time in the past 400,000 years. During ice ages, CO2 levels were around 200 parts per million (ppm), and during the warmer interglacial periods, they hovered around 280 ppm (see fluctuations in the graph). In 2013, CO2 levels surpassed 400 ppm for the first time in recorded history. This recent relentless rise in CO2 shows a remarkably constant relationship with fossil-fuel burning, and can be well accounted for based on the simple premise that about 60 percent of fossil-fuel emissions stay in the air.
Today, we stand on the threshold of a new geologic era, which some term the “Anthropocene”, one where the climate is very different to the one our ancestors knew.
[…Blah, blah, blah…]
We’ve all heard variations of this meme… ad nauseum… They tell us that levels of carbon dioxide (CO2) in the atmosphere are higher than they have been at any time in the past years.
This claim is generally based on the fact that Antarctic ice cores don’t indicate interglacial CO2 levels above 280-300 ppm at any point in the past 800,000 years or so. While this is true, does it actually inform us that atmospheric CO2 levels could not have been well over 300 ppm during pre-industrial times?
WAIS Divide and the Effects of Resolution on Amplitude
West Antarctic Ice Sheet Divide Ice Core
On December 1, 2011, the West Antarctic Ice Sheet (WAIS) Divide ice core project, funded by the National Science Foundation, reached its final depth of 3405 meters (11,171 feet; over 2 miles), recovering the longest U.S. ice core to date from the Polar Regions. The 12.2-centimeter (4.8-inch) diameter cylinders of ice that make up the ice core contain uniquely detailed information on past environmental conditions during the last 68,000 years, such as the atmospheric concentration of greenhouse gases, surface air temperature, wind patterns, the extent of sea ice around Antarctica, and the average temperature of the ocean. Successfully retrieving the ice core is the culmination of an eight-year project to obtain a paleoclimate record from one of the remotest parts of the Antarctic continent.
[…]
In the WAIS Divide ice core, each of the past 30,000 years of snowfall can be identified in individual layers of ice, with lower temporal resolution records extending to 68,000 years before present. By allowing an examination of past climate at an annual resolution, the ice core record is helping scientists understand why climate can change abruptly and how climate may unfold in the coming century.
Other ice-coring projects have produced cores of lower temporal resolution, showing that the current level of atmospheric greenhouse gases, which is due to the burning of fossil fuels, is the highest in at least 800,000 years. The ice from the WAIS Divide ice core that is between 30,000 and 68,000 years old — while not containing records with annual resolution — contains a higher time resolution record than previous projects.
[…]
This comment caught my attention:
Other ice-coring projects have produced cores of lower temporal resolution, showing that the current level of atmospheric greenhouse gases, which is due to the burning of fossil fuels, is the highest in at least 800,000 years.
This begs the question: Are the ice cores “of lower temporal resolution” capable of resolving century-scale shifts in atmospheric CO2? If not, then the conclusion “that the current level of atmospheric greenhouse gases, which is due to the burning of fossil fuels, is the highest in at least 800,000 years” is not supported.
The ice cores cannot resolve CO2 shifts that occur over periods of time shorter than twice the bubble enclosure period.
According to Neftel et al. (1988), CO2 fluctuation with duration of less than twice the bubble enclosure time (equivalent to approximately 134 calendar yr in the case of Byrd ice and up to 550 calendar yr in Dome Concordia) cannot be detected in the ice or reconstructed by deconvolution.
McElwain et al., 2001
Here is a schematic diagram of bubble trapping process for the DE08 ice core:
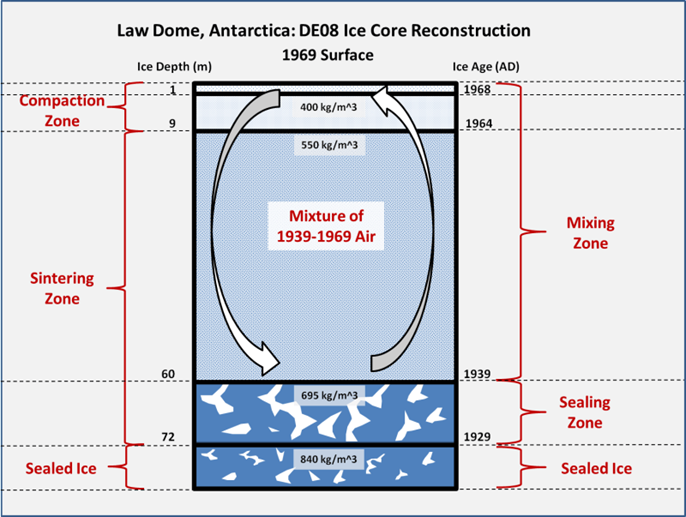
Figure 1. Schematic diagram of bubble enclosure process at Law Dome, DE08 ice core.
The DE08 core has a resolution at least as fine as 30 years, possibly as fine as 10 years.
Ahn et al., 2012 compared the resolutions of the WAIS Divide, Law Dome DE08 and Dronning Maud Land ice cores over the past 1,000 years and, unsurprisingly, found that the highest resolution core (DE08) had the highest amplitude range and resolved a sharp, short-duration drop in atmospheric CO2 during the nadir of the Little Ice Age (ca. 1610 AD).
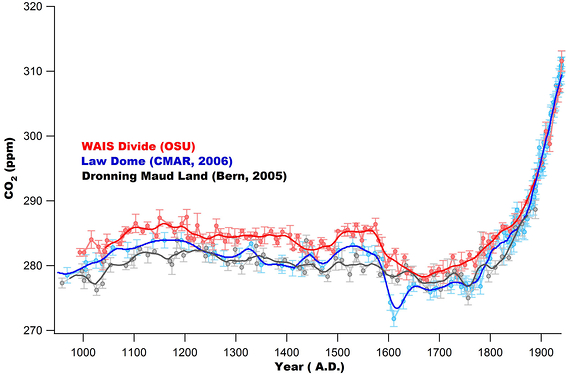
Figure 2. From Ahn et al., 2012: “Atmospheric CO2 for the last 1000 years. WAIS Divide data (red, this study) are compared with those from the Law Dome (blue) [Etheridge et al., 1996; MacFarling Meure et al., 2006] and EPICA Dronning Maud Land (black) [Siegenthaler et al., 2005]. To facilitate comparison of CO2 records, a Gaussian filter (1σ = 10 years) was applied to interpolated annual data sets (darker lines). OSU stands for Oregon State University and CMAR, CSIRO Marine and Atmospheric Research.”
The DE08 ice core’s resolution is so good, that it even detected a pause, possibly even a drop, in atmospheric CO2 during the mid-20th century cooling period.
The stabilization of atmospheric CO2 concentration during the 1940s and 1950s is a notable feature in the ice core record. The new high density measurements confirm this result and show that CO2 concentrations stabilized at 310–312 ppm from ~1940–1955. The CH4 and N2O growth rates also decreased during this period, although the N2O variation is comparable to the measurement uncertainty. Smoothing due to enclosure of air in the ice (about 10 years at DE08) removes high frequency variations from the record, so the true atmospheric variation may have been larger than represented in the ice core air record. Even a decrease in the atmospheric CO2 concentration during the mid-1940s is consistent with the Law Dome record and the air enclosure smoothing, suggesting a large additional sink of ~3.0 PgC yr-1 [Trudinger et al., 2002a]. The d13CO2 record during this time suggests that this additional sink was mostly oceanic and not caused by lower fossil emissions or the terrestrial biosphere [Etheridge et al., 1996; Trudinger et al., 2002a]. The processes that could cause this response are still unknown.
[11] The CO2 stabilization occurred during a shift from persistent El Niño to La Niña conditions [Allan and D’Arrigo, 1999]. This coincided with a warm-cool phase change of the Pacific Decadal Oscillation [Mantua et al., 1997], cooling temperatures [Moberg et al., 2005] and progressively weakening North Atlantic thermohaline circulation [Latif et al., 2004]. The combined effect of these factors on the trace gas budgets is not presently well understood. They may be significant for the atmospheric CO2 concentration if fluxes in areas of carbon uptake, such as the North Pacific Ocean, are enhanced, or if efflux from the tropics is suppressed.
MacFarling Meure et al., 2006
From about 1940 through 1955, approximately 24 billion tons of carbon went straight from the exhaust pipes into the oceans and/or biosphere:
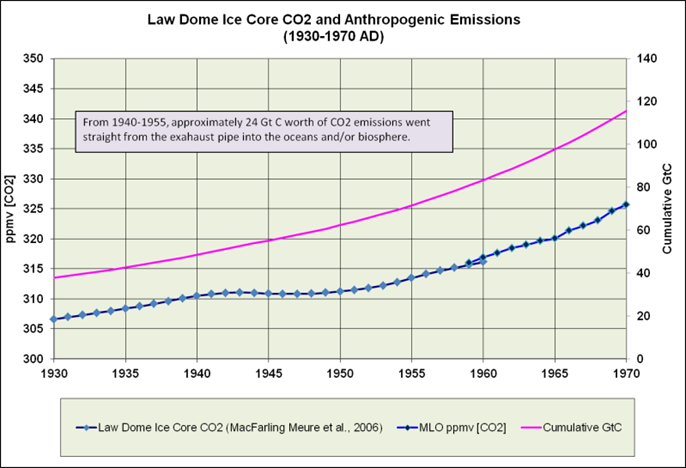
Figure 3. Law Dome DE08 ice core indicates a CO2 “pause” in the mid-20th century.
Ahn et al., 2012 constructed a series of synthetic ice cores of varying resolution to mostly explain the difference between the DE08 and WAIS Divide cores in resolving the LIA CO2 plunge ca. 1610 AD:
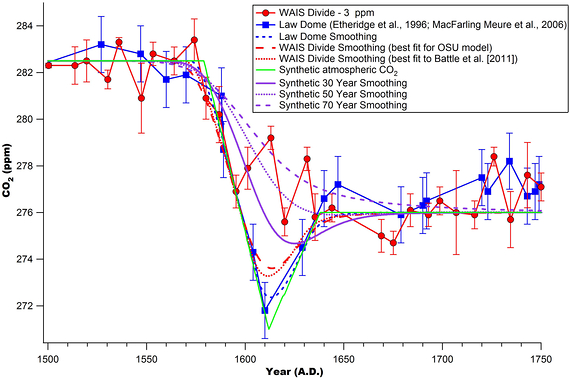
Figure 4. From Ahn et al., 2012: “Smoothing an imaginary atmospheric CO2 time series (green line).
The synthetic atmospheric CO2 time series has slightly larger decrease of CO2 than Law Dome records at ∼1600 A.D. To better compare magnitude of CO2 decrease at ∼1600 A.D., we subtracted 3 ppm of CO2 concentration from WAIS Divide core record (blue line) and compared with three synthetic smoothing curves (purple lines).”
There is a fundamental relationship between frequency and amplitude. If you apply a low pass filter or smoothing average to a time series, you attenuate the amplitude response:
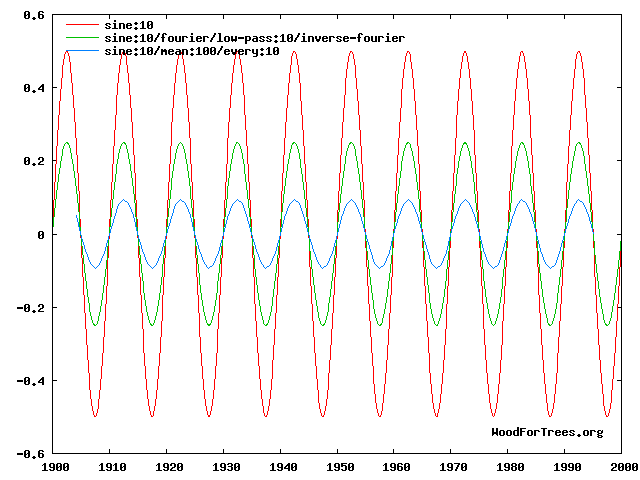
Figure 5. Sin wave with low pass filter and 10-pt smoothing average applied. Note the reduction in amplitude due to filtering and/or smoothing.
(Wood for Trees – http://www.woodfortrees.org/plot/sine:10/plot/sine:10/fourier/low-pass:10/inverse-fourier/plot/sine:10/mean:100/every:10)
I downloaded a composite ice core CO2 record (0-800 kyr BP) from Bereiter et al. (2014) and generated the standard CO2 Hockey Stick:
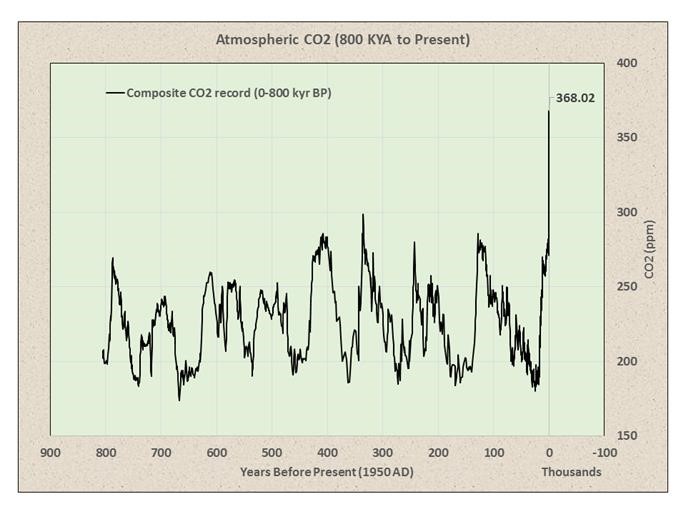
Figure 6. Composite CO2 record (0-800 kyr BP) from Bereiter et al. (2014).
This is a composite of the following ice cores:
This is a composite of the following ice cores:
|
-51-1800 yr BP:’ |
Law Dome (Rubino et al., 2013) |
|
1.8-2 kyr BP: |
Law Dome (MacFarling Meure et al., 2006) |
|
2-11 kyr BP: |
Dome C (Monnin et al., 2001 + 2004) |
|
11-22 kyr BP: |
WAIS (Marcott et al., 2014) minus 4 ppmv (see text) |
|
22-40 kyr BP: |
Siple Dome (Ahn et al., 2014) |
|
40-60 kyr BP: |
TALDICE (Bereiter et al., 2012) |
|
60-115 kyr BP: |
EDML (Bereiter et al., 2012) |
|
105-155 kyr BP: |
Dome C Sublimation (Schneider et al., 2013) |
|
155-393 kyr BP: |
Vostok (Petit et al., 1999) |
|
393-611 kyr BP: |
Dome C (Siegenthaler et al., 2005) |
|
612-800 kyr BP: |
Dome C (Bereiter et al., 2014) |
These ice cores are of vastly different resolutions. Petit et al., 1999 indicate that the CO2 resolution for Vostok is 1,500 years. Lüthi et al., 2008 suggest a CO2 resolution of about 500 years for Dome C. It appears that the high resolution Law Dome DE08 core was just spliced on to the lower frequency older ice cores.
If I apply smoothing filters to the DE08 ice core in order to match the resolution of the lower resolution ice cores, I get a considerably different picture.
Using the information in Table 1 from Ahn et al., 2012:
|
Ice Core Name |
Mean Temp.
(°C) |
Acc. Rate
(cm
we/yr) |
Ice-Gas Age
Diff. (yr) |
Gas Age
Distribution (yr) |
Reference for
Gas Age Distribution |
|
Dronning Maud Land |
–44.6 |
6.4 |
835 |
59 ± 5 |
|
|
DE-08 (Law Dome) |
–19 |
110 |
31 |
10 |
|
|
DSS (Law Dome) |
–22 |
60 |
58 |
14 |
|
|
WDC05A (WAIS Divide) |
–31 |
22 |
205 |
≥30? |
this study |
I plotted the relationship between Ice-Gas Age Difference and Gas Age Distribution and used this to calculate a gas age distribution for the Holocene portion Vostok core:
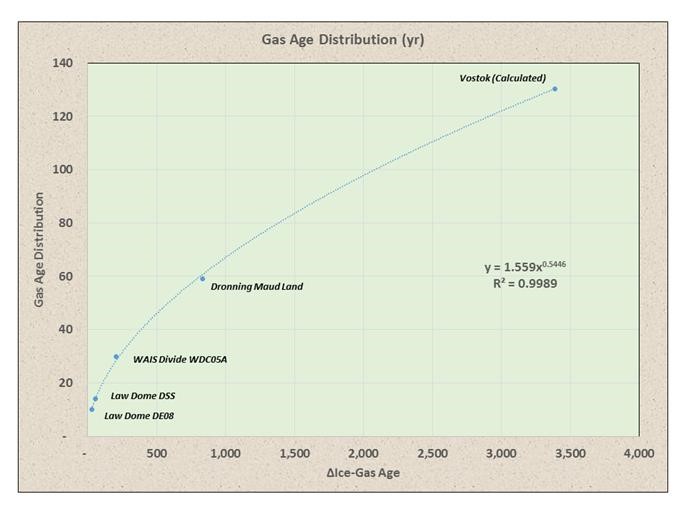
Figure 7. Δice-gas age vs gas age distribution suggests a gas age distribution of 130 years for the Holocene portion of the Vostok ice core.
The application of a 130-yr smoothing filter to the DE08 core yields a Hockey Stick with a seriously shortened blade:

Figure 8. A 130-yr smoothing filter makes the industrial era rise in CO2 appear far less anomalous.
If I use a 500-yr smoothing filter, the Hockey Stick loses its blade completely:
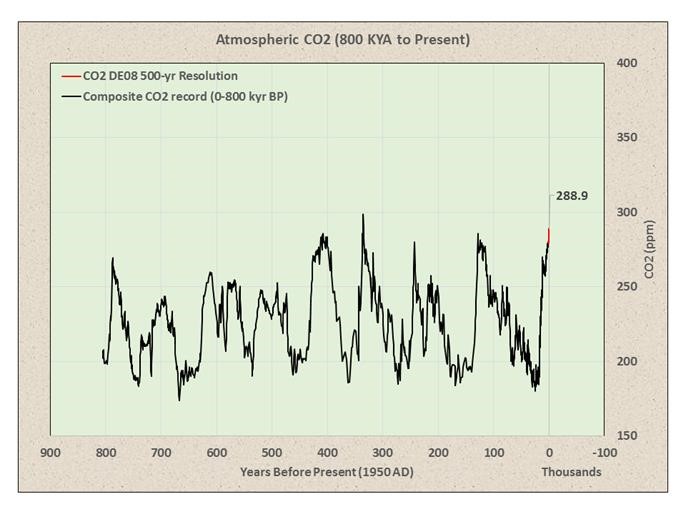
Figure 9. A 500-yr smoothing filter totally removes the Hockey Stick’s blade.
I didn’t even try to use the instrumental record, because it would be a single data point at the same resolution as the Vostok and EPICA Dome C ice cores.
The lower frequency ice cores are not capable of resolving century scale CO2 shifts. As such, they cannot be used to rule out the possibility of short duration fluctuations comparable to the industrial era rise in atmospheric CO2 during the early Holocene and Pleistocene. And thus do not contradict the conclusions of Wagner et al., 1999:
In contrast to conventional ice core estimates of 270 to 280 parts per million by volume (ppmv), the stomatal frequency signal suggests that early Holocene carbon dioxide concentrations were well above 300 ppmv.
[…]
Most of the Holocene ice core records from Antarctica do not have adequate temporal resolution.
[…]
Our results falsify the concept of relatively stabilized Holocene CO2 concentrations of 270 to 280 ppmv until the industrial revolution. SI-based CO2 reconstructions may even suggest that, during the early Holocene, atmospheric CO2 concentrations that were 300 ppmv could have been the rule rather than the exception.
Or Wagner et al., 2004:
The majority of the stomatal frequency-based estimates of CO 2 for the Holocene do not support the widely accepted concept of comparably stable CO2 concentrations throughout the past 11,500 years. To address the critique that these stomatal frequency variations result from local environmental change or methodological insufficiencies, multiple stomatal frequency records were compared for three climatic key periods during the Holocene, namely the Preboreal oscillation, the 8.2 kyr cooling event and the Little Ice Age. The highly comparable fluctuations in the paleo-atmospheric CO2 records, which were obtained from different continents and plant species (deciduous angiosperms as well as conifers) using varying calibration approaches, provide strong evidence for the integrity of leaf-based CO2 quantification.
Ahn, J., E. J. Brook, L. Mitchell, J. Rosen, J. R. McConnell, K. Taylor, D. Etheridge, and M. Rubino (2012), Atmospheric CO2 over the last 1000 years: A high-resolution record from the West Antarctic Ice Sheet (WAIS) Divide ice core, Global Biogeochem. Cycles, 26, GB2027, doi:10.1029/2011GB004247. LINK
Bereiter, Bernhard. Sarah Eggleston, Jochen Schmitt, Christoph Nehrbass-Ahles, Thomas F. Stocker, Hubertus Fischer, Sepp Kipfstuhl and Jerome Chappellaz. 2015. Revision of the EPICA Dome C CO2 record from 800 to 600 kyr before present. Geophysical Research Letters. . doi: 10.1002/2014GL061957. LINK
Bereiter et al. (2014), Revision of the EPICA Dome C CO2 record from 800 to 600 kyr before present, Geophysical Research Letters, doi: 10.1002/2014GL061957. Data
Lüthi, D., M. Le Floch, B. Bereiter, T. Blunier, J.-M. Barnola, U. Siegenthaler, D. Raynaud, J. Jouzel, H. Fischer, K. Kawamura, and T. F. Stocker. 2008. High-resolution carbon dioxide concentration record 650,000-800,000 years before present. Nature 453(7193):379-382, doi: 10.1038/nature06949. LINK
MacFarling Meure, C., D. Etheridge, C. Trudinger, P. Steele, R. Langenfelds, T. van Ommen, A. Smith, and J. Elkins. 2006. The Law Dome CO2, CH4 and N2O Ice Core Records Extended to 2000 years BP. Geophysical Research Letters, Vol. 33, No. 14, L14810 10.1029/2006GL026152. LINK Data
McElwain et al., 2001. Stomatal evidence for a decline in atmospheric CO2 concentration during the Younger Dryas stadial: a comparison with Antarctic ice core records. J. Quaternary Sci., Vol. 17 pp. 21–29. ISSN 0267-8179. LINK
Petit J.R., Jouzel J., Raynaud D., Barkov N.I., Barnola J.M., Basile I., Bender M., Chappellaz J., Davis J., Delaygue G., Delmotte M., Kotlyakov V.M., Legrand M., Lipenkov V., Lorius C., Pépin L., Ritz C., Saltzman E., Stievenard M., 1999, Climate and Atmospheric History of the Past 420,000 years from the Vostok Ice Core, Antarctica, Nature, 399, pp.429-436. LINK
Petit, J.R., et al., 2001, Vostok Ice Core Data for 420,000 Years, IGBP PAGES/World Data Center for Paleoclimatology Data Contribution Series #2001-076. NOAA/NGDC Paleoclimatology Program, Boulder CO, USA. LINK
Wagner F, et al., 1999. Century-scale shifts in Early Holocene CO2 concentration. Science 284:1971–1973.
Wagner F, Kouwenberg LLR, van Hoof TB, Visscher H, 2004. Reproducibility of Holocene atmospheric CO2 records based on stomatal frequency. Quat Sci Rev 23:1947–1954
We should revisit occasionally what the proper role of government is. As the constitution was a good sense of direction, we need a core set of principles to add in order to deal with the future.
So many want to engineer society, remove risk, assist certain groups, rather than let individuals thrive and raise communities. Why?
Is Democracy where we all "get it good and hard" or is it the best means to a free society?
Should we roll with the special interests, or make the government achieve its proper role, what is that role, and how to do this?
When do deficits and governments become too large?
Government is becoming more elitist while trying to sell corrections to problems it created, what makes this possible?
This could also be inserted into the field above, or erased
Currently as a society, we are having a most difficult time discussing political issues. What is driving this? And why a rebirth in political culture would be a good thing.
Are "markets" dead as some would conjecture? Or is free enterprise what got us here?
At the heart of economics there are several possible economic schools of thought, the essence of these schools of thought and how they relate to our lives.